# Runtime Commands
It is possible to query and even change the state of entities like items or things. Therefore the console offers commands in various areas:
Note
Some of the described commands are executed on the internal database and could break your installation. Please use this functionality only if you know what you are doing!
# Examples
Query an item's state:
openhab> openhab:status Heating_GF_Corridor
OFF
Changing an item's state:
openhab> openhab:send Heating_GF_Corridor ON
Command has been sent successfully.
Get help for a command:
openhab> help openhab:send
Usage: openhab:send <item> <command> - sends a command for an item
# openHAB Commands
# Items
| Command | Description |
|---|---|
openhab:status <item> | shows the current status of an item |
openhab:update <item> <state> | sends a status update for an item |
openhab:send <item> <command> | sends a command for an item |
openhab:items list [<pattern>] | lists names and types of all items (matching the pattern, if given) |
openhab:items clear | removes all items |
openhab:items remove <itemName> | removes the given item |
# Discovery
| Command | Description |
|---|---|
openhab:discovery start <thingTypeUID!bindingID> | runs a discovery on a given thing type or binding |
openhab:discovery enableBackgroundDiscovery <PID> | enables background discovery for the discovery service with the given PID |
openhab:discovery disableBackgroundDiscovery <PID> | disables background discovery for the discovery service with the given PID |
# Inbox
| Command | Description |
|---|---|
openhab:inbox list | lists all current inbox entries |
openhab:inbox listignored | lists all ignored inbox entries |
openhab:inbox approve <thingUID> <label> | creates a thing for an inbox entry |
openhab:inbox clear | clears all current inbox entries |
openhab:inbox ignore <thingUID> | ignores an inbox entry permanently |
# Things
| Command | Description |
|---|---|
openhab:things list | lists all things |
openhab:things clear | removes all managed things |
# Links
| Command | Description |
|---|---|
openhab:links list | lists all links |
openhab:links link <itemName> <channelUID> | links an item with to channel |
openhab:links unlink <itemName> <thingUID> | unlinks an item with to channel |
openhab:links clear | removes all managed links |
openhab:links orphan <list\|purge> | lists/purges all orphaned - one missing element (either item or channel) - links |
# Audio
| Command | Description |
|---|---|
openhab:audio play [<sink>] <filename> | plays a sound file from the $OPENHAB_CONF/sounds folder through the optionally specified audio sink(s) |
openhab:audio play <sink> <filename> <volume> | plays a sound file from the $OPENHAB_CONF/sounds folder through the specified audio sink(s) with the specified volume |
openhab:audio stream [<sink>] <url> | streams the sound from the url through the optionally specified audio sink(s) |
openhab:audio sources | lists the audio sources |
openhab:audio sinks | lists the audio sinks |
# Voice
| Command | Description |
|---|---|
openhab:voice say <text> | speaks a text on the default audio sink with the default TTS and voice |
openhab:voice voices | lists available voices of the active TTS services |
openhab:voice interpret <command> | interprets a human language command |
# Automation
| Command | Description |
|---|---|
openhab:script <script to execute> | Executes a script from the $OPENHAB_CONF/scripts folder |
# Firmware
| Command | Description |
|---|---|
openhab:firmware list <thingTypeUID> | Lists the available firmwares for a thing type. |
openhab:firmware status <thingUID> | lists the firmware status for a thing |
openhab:firmware update <thingUID> <firmware version> | updates the firmware for a thing |
# Users
| Command | Description |
|---|---|
openhab:users list | lists all users |
openhab:users add <userId> <password> <role> | adds a new user with the specified role |
openhab:users remove <userId> | removes the given user |
openhab:users changePassword <userId> <newPassword> | changes the password of a user |
openhab:users listApiTokens | lists the API tokens for all users |
openhab:users addApiToken <userId> <tokenName> <scope> | adds a new API token on behalf of the specified user for the specified scope |
openhab:users rmApiToken <userId> <tokenName> | removes (revokes) the specified API token |
openhab:users clearSessions <userId> | clear the refresh tokens associated with the user (will sign the user out of all sessions) |
# Karaf Commands
Apache Karaf itself also provides many useful commands, especially for debugging and development purposes.
# Thread Monitor
When experiencing high CPU usage by openHAB, one of its threads might be running wild.
Similarly to the familiar htop command on Linux, Karaf provides the ttop command to analyse CPU usage per thread.
The following example of the ttop command displays thread ID, name, state and various stats about each thread, all ordered by the CPU time:
ttop --stats=tid,name,state,waited_time,waited_count,blocked_time,blocked_count,user_time,cpu_time,user_time_perc,cpu_time_perc,lock_owner_id,lock_owner_name --order=cpu_time --millis=300
To get more information about a thread, you may use the following command, where XXXX is the thread ID:
threads XXXX
# Example
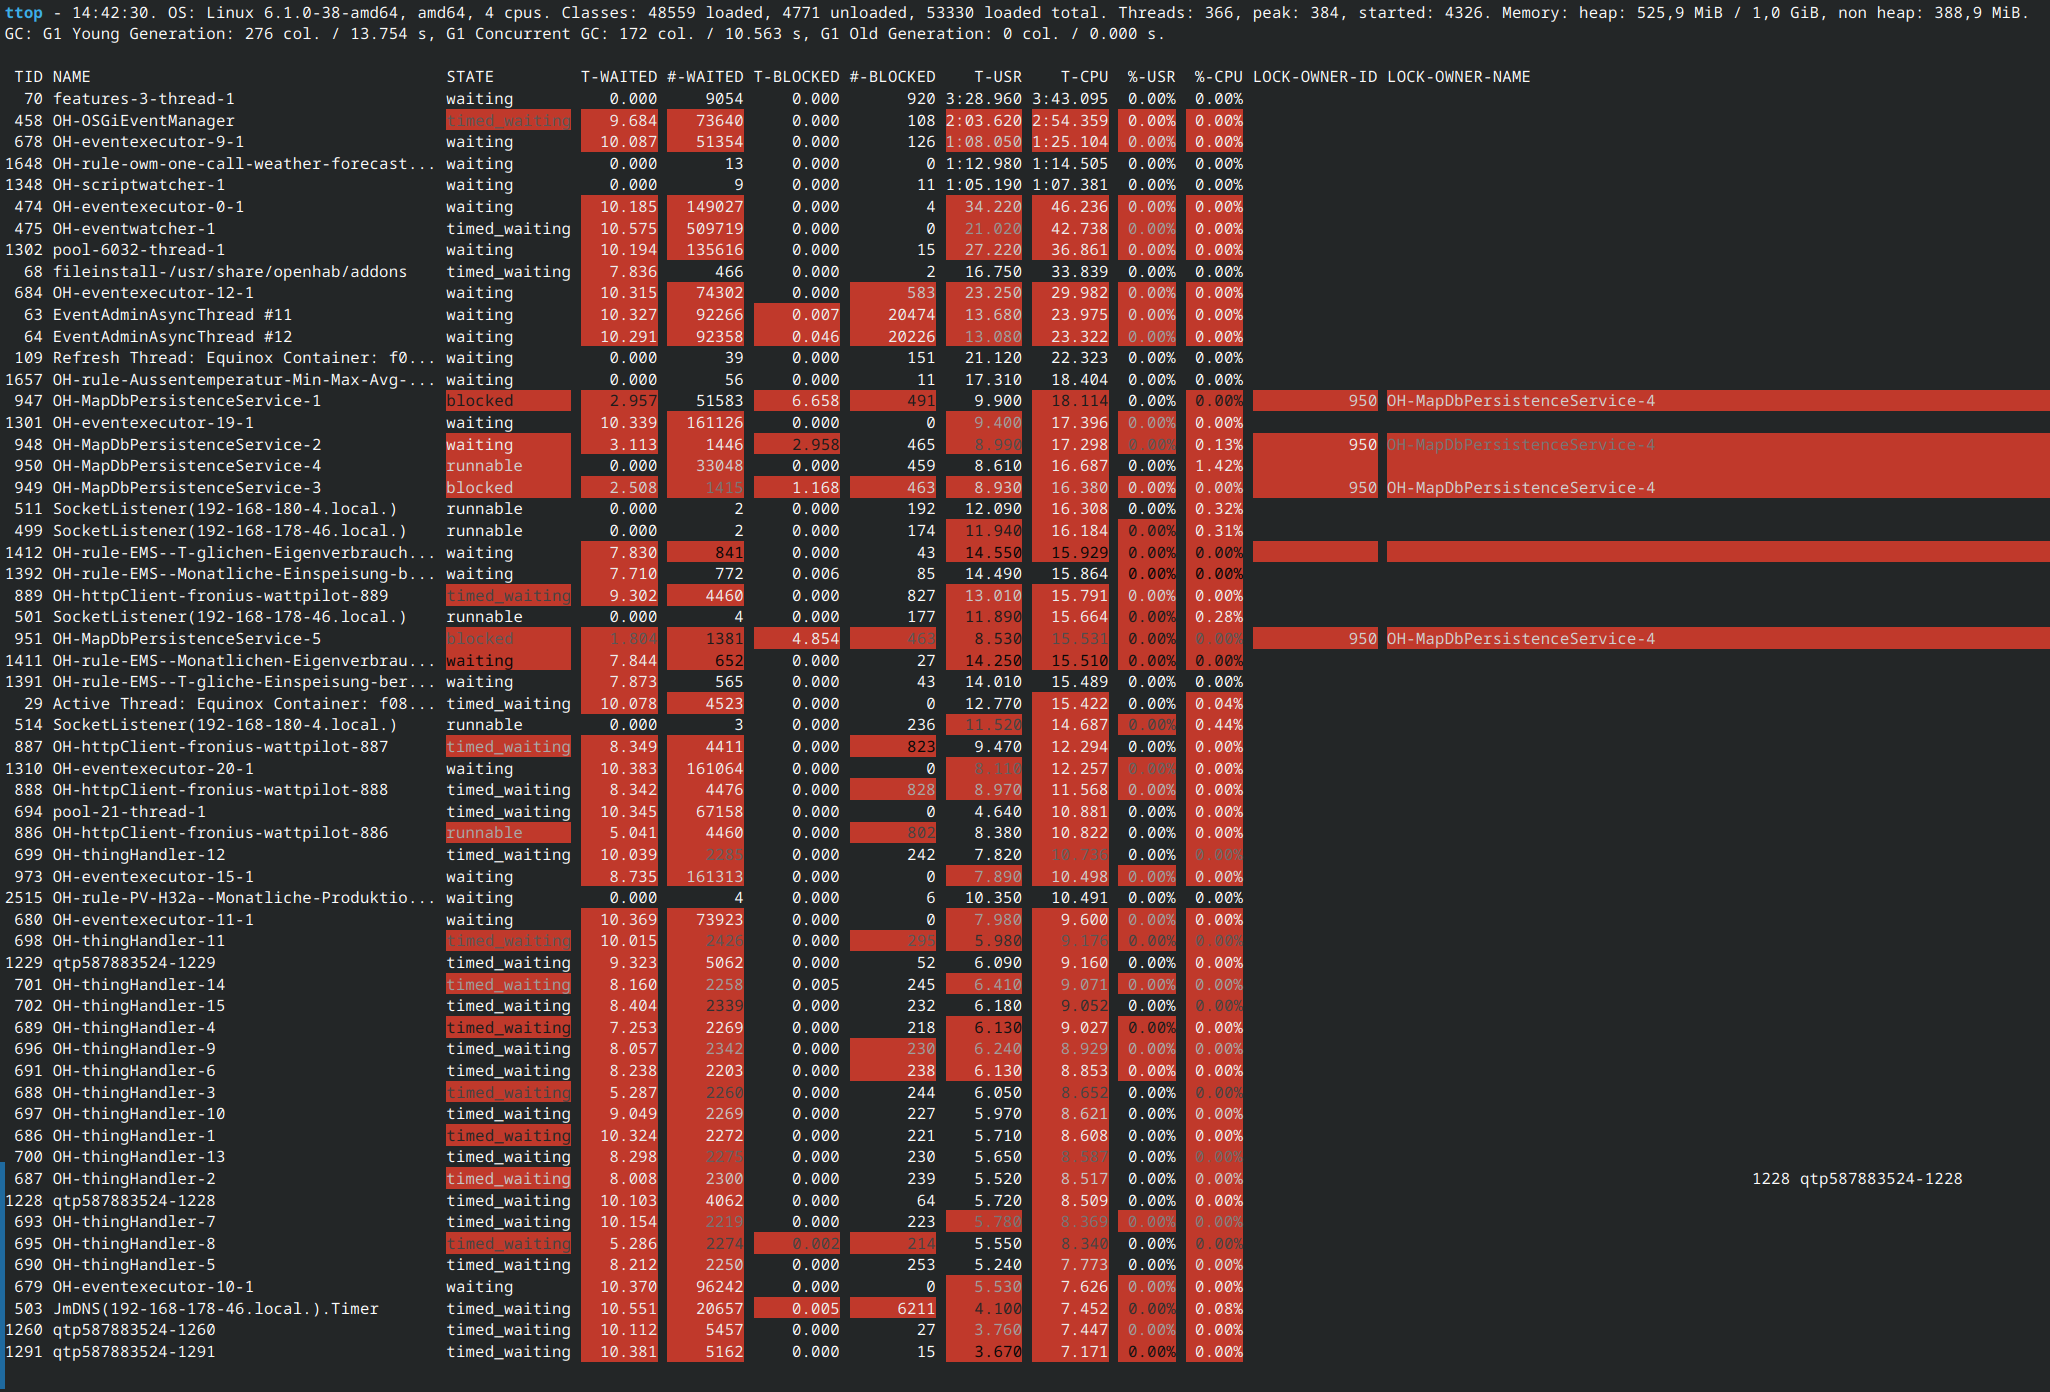
As you can see, there are a few rule and MapDB threads consuming a good amount, as well as openHAB's OSGiEventManager.
To get more details about the OH-OSGiEventManager thread, use the threads command: threads 458
The following information is printed to the console:
Thread 458 OH-OSGiEventManager TIMED_WAITING
Stacktrace:
jdk.internal.misc.Unsafe.park line: -2
java.util.concurrent.locks.LockSupport.parkNanos line: 269
java.util.concurrent.locks.AbstractQueuedSynchronizer$ConditionObject.awaitNanos line: 1763
java.util.concurrent.LinkedBlockingQueue.poll line: 460
org.openhab.core.internal.events.ThreadedEventHandler.lambda$0 line: 59
org.openhab.core.internal.events.ThreadedEventHandler$$Lambda/0x0000000100b44258.run line: -1
java.lang.Thread.runWith line: 1596
java.lang.Thread.run line: 1583
# Heap & Thread Dumps
You can create a heap dump and thread dump of the JVM to analyse memory and thread leaks:
dev:dump-create
Created dump zip: 2025-08-08_171434.zip
You will find this ZIP in the $OPENHAB_USERDATA folder, usually /var/lib/openhab/ on Linux systems.
Note
The thread dumps created from Karaf lacks some important information for troubleshooting blocked threads. See alternative ways to create thread dumps below if that is the intended use.
Please refer to the Karaf Developer Commands documentation (opens new window) for more information about all available commands.
# Thread Dumps
Thread dumps capture the state of all JVM threads and are essential when diagnosing high CPU usage, deadlocks or blocked threads. Below are several methods to produce thread dumps.
# Java Process Identifier
The command line tools described here require the process identifier (PID) of the Java process as an argument. To find the PID, open a command console and run one of the following commands:
ps u -C java                          # Linux
ps aux | grep java                    # macOS/Linux
tasklist /FI "IMAGENAME eq java.exe"  # Windows
Sometimes, more than one entry is returned, and it might not be obvious which one is openHAB. In most situations it will either only be one entry, or it will be obvious which one is openHAB.
# Using jstack
jstack is part of the JDK and prints a full thread dump from a running JVM.
Required privileges will usually be root/administrator: prefix with sudo on Linux and macOS, use an elevated command prompt on Windows.
This command will create a new file called threaddump.txt in the current directory, which contains the thread dump information:
jstack -l <PID> > threaddump.txt
jstack is located in the JDK bin directory.
# Using jcmd
jcmd is another JDK tool that can trigger many diagnostic actions.
It also usually requires sudo (Linux/macOS) or elevated command prompt (Windows).
This command will create a new file called threaddump.txt in the current directory, which contains the thread dump information:
jcmd <PID> Thread.print -l > threaddump.txt
# Using VisualVM / Java Mission Control
GUI tools such as VisualVM (opens new window) or Java Mission Control (JMC) (opens new window) can attach to a running JVM (local or remote with JMX) and provide thread dumps with additional visualization and analysis tools. Setting up remote access can be a bit of work and isn't covered here, so these tools are recommended only if openHAB is running on a computer with a desktop environment, but are excellent options when that is the case.
# Inside Containers and Remote Systems
For Docker containers, either exec into the container and run jcmd/jstack:
docker exec -it <container> jcmd <PID> Thread.print -l
For remote systems without SSH access to JDK tools, remote JMX can be configured and enabled to allow remote access from VisuaVM or Java Mission Control, but the details for doing this must be acquired elsewhere.
# Helpful Tips
- Always run diagnostic tools with appropriate privileges (e.g.,
sudoon Linux). - If you need to correlate a Java thread to an OS thread, look for the
nidvalue in the thread dump (usually hex). Convert it to decimal to compare withtop/psthread ids. - If a thread dump is not enough, capture several dumps spaced a few seconds apart to see which stacks are consistently present (useful for intermittent CPU spikes).